Plotting points
Consider two vectors of the same length:
If you want to create a scatter plot of the (x, y) pairs, you can use the plot command:
plot(x, y, pch = 19)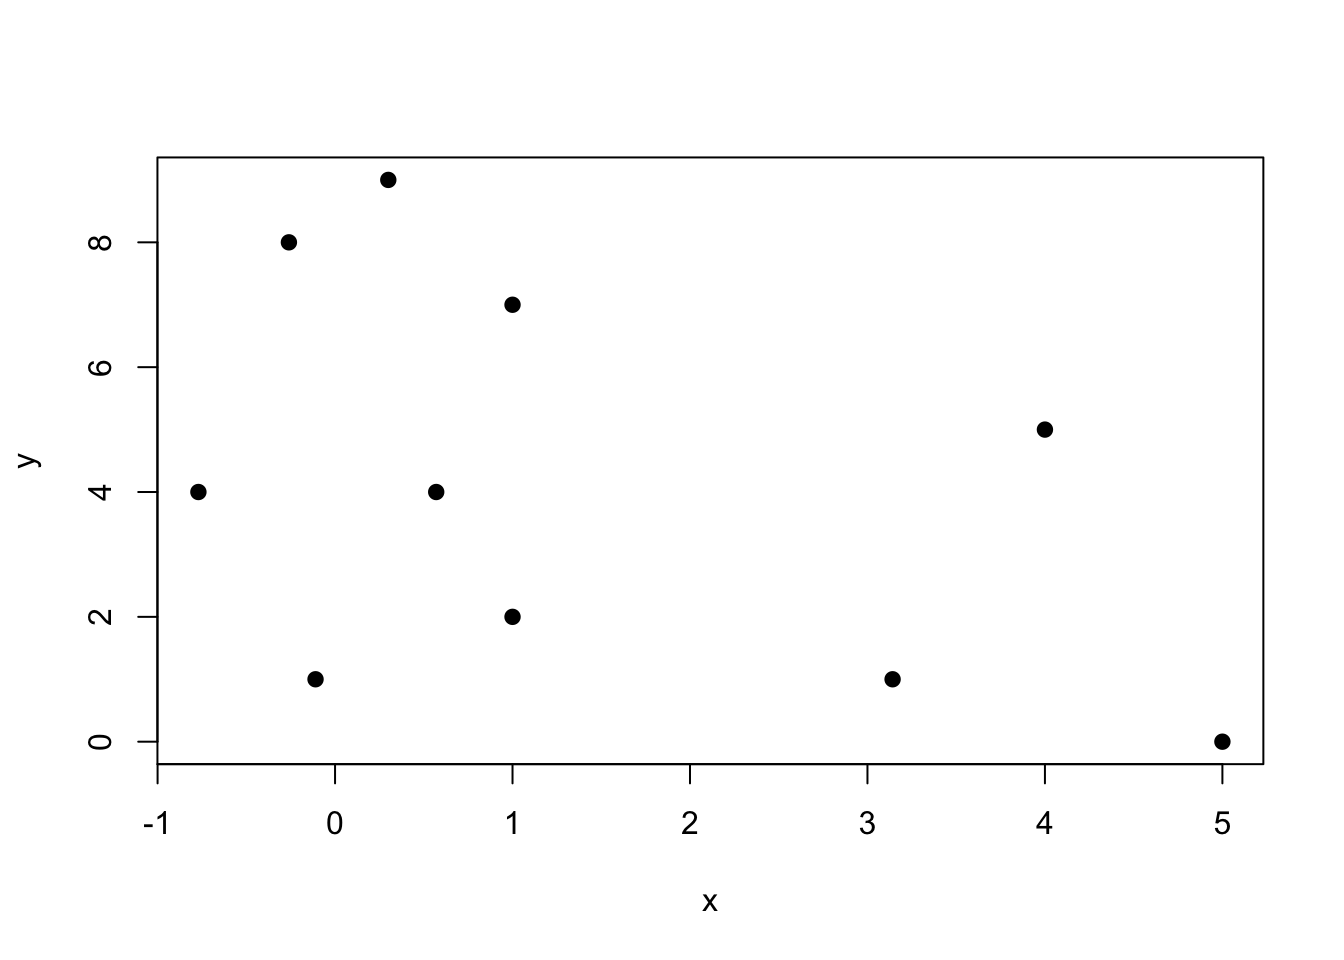
If you wanted, for example, to plot the PMF of the binomial distribution, then your x vector has every value in the range, and your y vector has all of the individual probabilities:
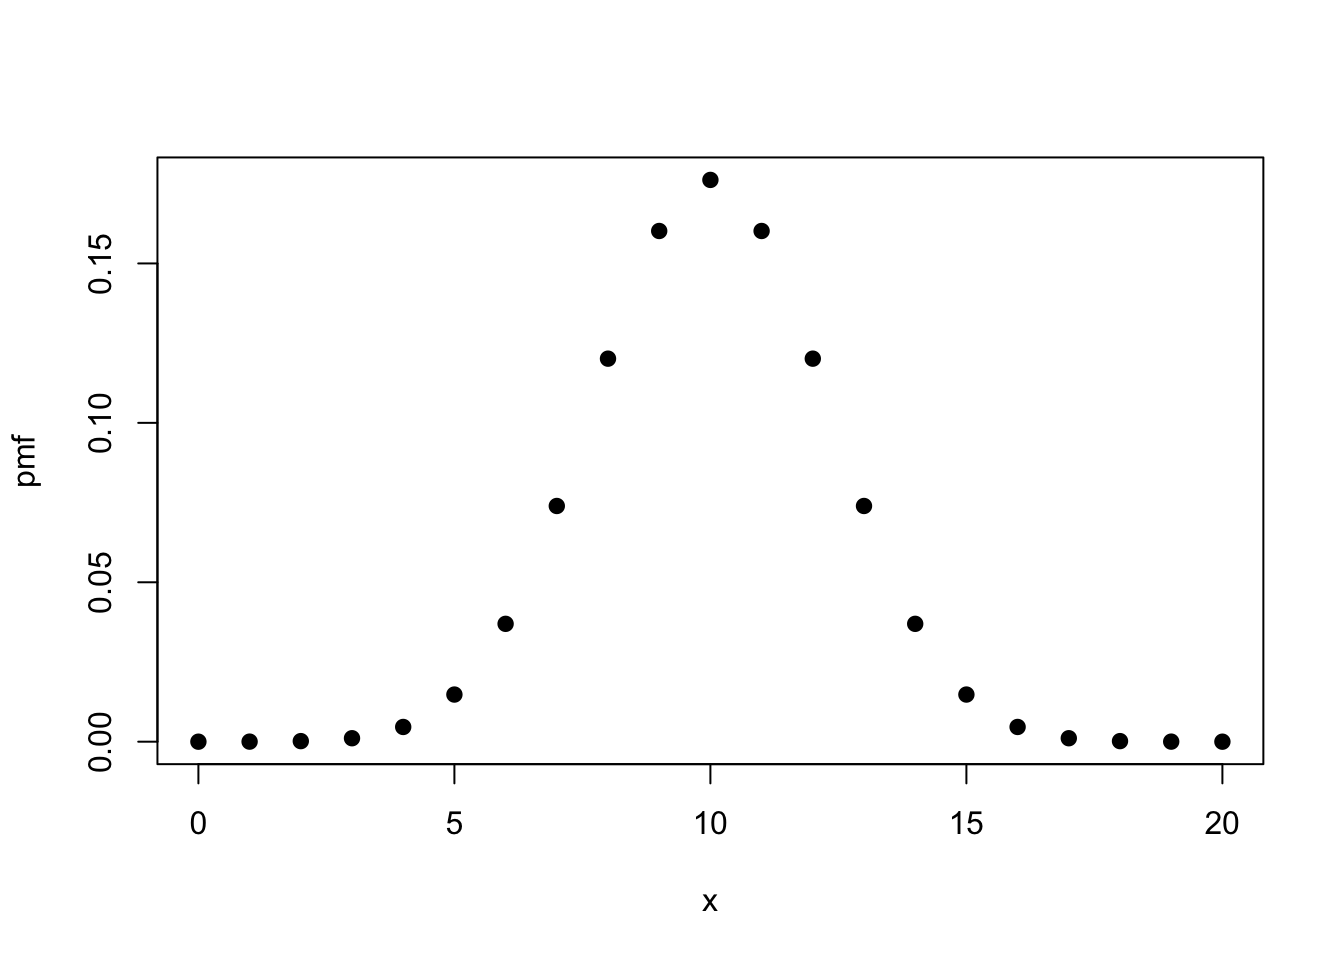
Notice that we made use of the fact that the dbinom command is vectorized in its first argument; if you give it a vector with multiple values, it returns a vector with the probabilities for each one.